About Our System
This Is a Constant Work In Progress
Due to the variation across different sports and the inability to objectively compare the importance of player stats side-by-side, this ranking system will never be completely accurate. We can only hope to approach accuracy with our comparisons. All rankings are subject to change, regardless of whether the season in question is complete or not, as the underlying scoring and percentile gathering formulas are subject to change.
How Do We Get Our Rankings?
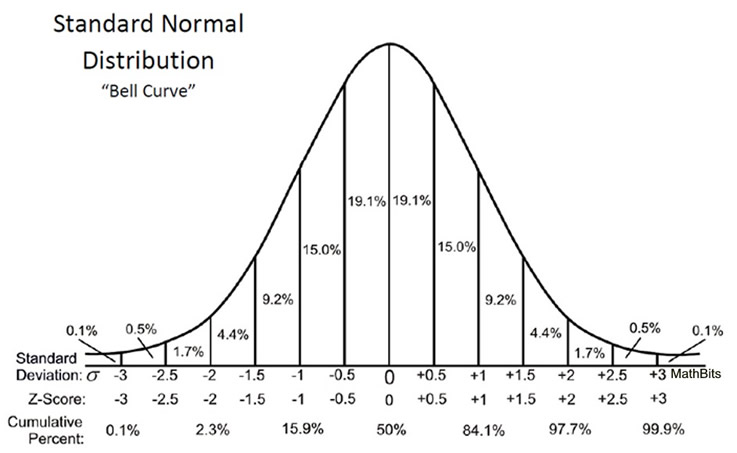
The Player-Ranking system was developed through statistical analysis of HUDL's athlete performance data. Because each statistic is measured on a different scale (i.e. an ace might be easier to get compared to a touchdown), in order to better represent an athlete's relative performance between different sports and positions, we standardized each statistic. This is done through calculating the statistic "z-score" of each skill measured by the HUDL interface, which measures how much higher or lower a player's performance is for a skill compared to the mean value of that skill for the rest of the team. The program calculates the s-score (which uses the z-score and corrects for amount of people in each stat category) for each skill HUDL provides (ex: touchdowns, aces, serve receives, etc.) and then weight these s-scores to make a mean s-score that is representative of that athlete's performance during the set time-interval chosen. This new s-score is then converted to a percentile based on a normal distribution curve which can then be compared to different athletes' percentiles from different sports to acheive a final score, which is how we rank the athletes. ONLY TOP 100 ARE SHOWN
Exceptions
There are a few exceptions for athletes that play sports that have fewer players, notably cross country and football-passing. For these sports, a different metric is used.
Football Passing (QB)
For football-passing, the NFL stat "passer rating" is calculated which ranges from 0 - 158.3. This is then scaled down to a range from 0-100 to match the percentiles. The hope is, by using this method, we will yield more accurate comparisons when comparing football-passing ahletes to other sports, as the previous approach breaks down when there are too few players.
Cross Country
For cross-country, we used the 5k times to create the percentiles using the same approach as all the other sports, excluding football-passing and we calculate this as the only "stat" for cross-country. Then, using a similar approach to the previous, we get the s-scores. Howver, the exception here is that a smoothing and steepness function is applied to the s-scores, to keep the s-score percentiles within accurate and reasonable ranges.